Case Study
Completion Fluids FR HVFR Crosslinked Gel BOE Cost per BOE
Multi-well Production Evaluation
To begin I gathered and cleaned a large dataset of completion variables of various producing oil wells. To keep the analysis consistent the wells were chosen with constraints:
- Wells had to been stimulated with modern methods. Only wells from 2018 onward were selected.
- Wells need to be regionally constrained. All wells were selected from a 100 mile radius.
- Wells must have completed data inclusive of drilling and completion parameters.
- Wells must have at least 6 months of production data.
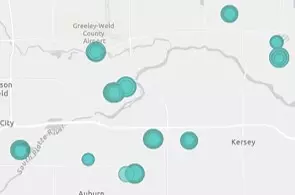
The dataset consisted of 180 completed wells with complete and comprehensive completion metrics. The geographic spread of these wells are shown below:
The investigation began with looking at two key completion metrics: total fluid barrels (bbls) pumped, total pounds (lbs.) of proppant pumped, and total 6 month barrels of oil extracted (BOE). Due to variability in the completed intervals between wells, All completion metrics had to be normalized to feet (ft.) of horizontal completed length for a fair comparison. The charts below depict the scatter plots of the normalized volume and proppant consumed versus the normalized 6 month production. The dotted lines highlight the averages of the axes.
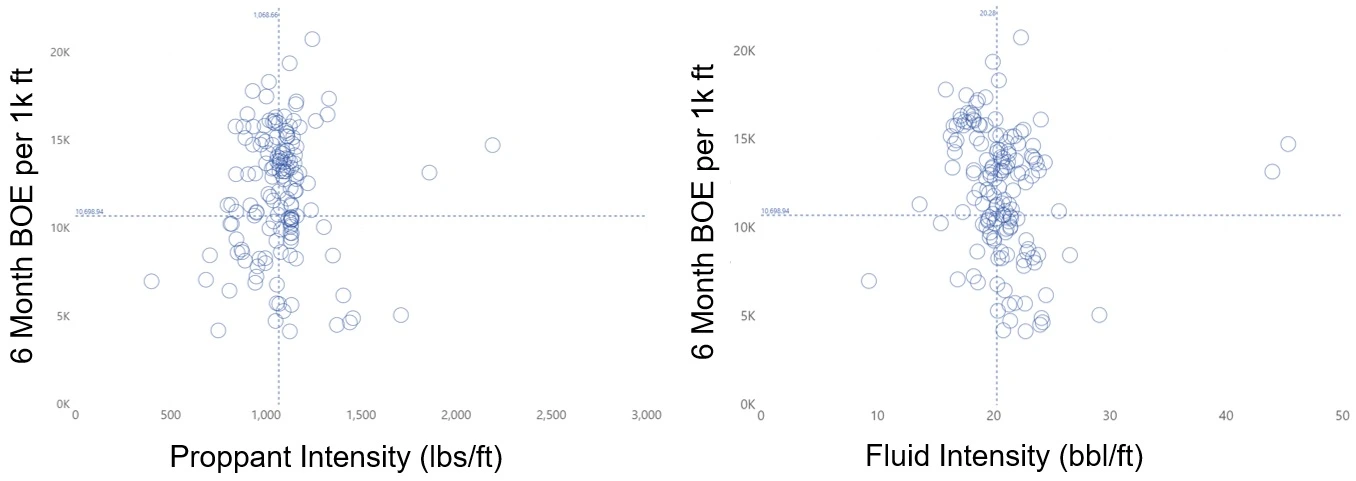
Not surprisingly, the chart depicts the all-too-common shotgun-scatter of data points spread amongst the
mean - this isn't terribly helpful.
We are able to get a few insights and see
most completions range from 700-1300 lbs/ft of proppant intensity with 15-25 bbls/ft. This is good since we
now understand most all these wells were completed in a similar fashion.
We also can intuitively understand the more proppant and fluid consumed during a completion the more
expensive the service is going to be for the operator. Looking at this chart we see completions that fall in
the bottom right quadrant
are the most expensive and least productive, and the completions in the top left are the least expensive and
most productive.
Operators always are looking to maximize production from their wells, but the ultimate goal is to extract
the most oil production with the least cost - operators are targeting the upper left quadrant of
these charts.
Unfortunately, nothing here explains the large variability of the y-axis for the standardized 6 month
production. We'll have to look at other variables to investigate.
Completion Fluids
The next step in this study is to understand if there exists a specific completion fluid which on average
results in a greater economic value to the operator.
Value in this context is described on the cost of the completion with respect to the 6 month production
standardized to total completed horizontal length of the well.
This value metric is the cost per barrel of oil extracted ($/BOE). First, we must determine how to define
the type of completion fluid used for each well.
During well completions a large variety of chemicals are mixed with water to transport proppant deep into
the fractures to ensure a conductive channel
connects the reservoir to wellbore. The specific variety of chemicals used constitutes a "fluid system".
Traditionally fluid systems come in three flavors: an expensive crosslinked gel system that can carry high
concentrations
of proppant; cheaper, low concentration friction reducers that allow for high fluid rates and lower proppant
concentrations; and high viscosity friction reducers which provide
a happy median between the two. Operators may also elect to perform completions with "hybrid" fluid
compositions which utilize a variety of fluids depending on
various completion factors such as rate, time to completion, and proppant concentration needed. In order to
objectively determine the fluid type used the total consumed quantity
of each fluid type was totaled for each well and then calculated as a percentage of the total volume used to
complete the well. The fluid type percentage distribution is
charted on the below ternary plot identifying fluid composition by F1, F2, and F3.
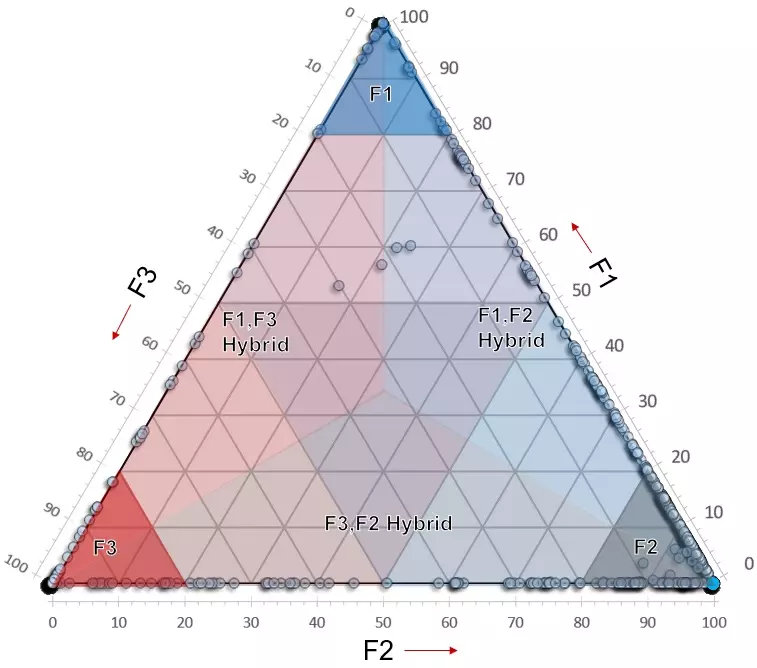
We'll define a well completed with a singular fluid system as one where at least 80% of the total fluid volume is composed of one specific fluid. We see a wide distribution of wells completed with the three different types of fluid systems. The ternary chart illustrates a wide popularity of "hybrid" fluid systems where more than one fluid system utilized during the course of the completion. Interestingly, it is quite rare to see completions which utilize all three types of fluid systems. The likely reasoning is due to logistical challenges of supplying additional chemicals onto location, as well as the operational complications created by switching fluids systems on-the-fly.
The next step is to determine whether our original key metrics vary when we take a look at well completion fluid systems. This is important since we want to make sure there are not important auxiliary variables which may impact our economic analysis. The below box-and-whiskers chart plots the wells completed with >80% of a specific fluid system verses the key completion variables of proppant intensity, fluid intensity, and average proppant concentration.

These charts demonstrate despite there being a difference in the completion fluid, we do not see a wide variance in the key completion variables - total proppant and fluid totals remain largely similar. Finally we can look into the key objective: whether or not a specific fluid composition is more favorable economically. This is measured by taking the total cost of each well's completion and normalize the cost to 1000 completed horizontal length and bin the results to the well's primary completion fluid ($/1000ft). We can then take this $/1000ft variable and compare it to each well's normalized 6 month production metric to arrive at cost per barrel of oil produced ($/BOE). The charts describing these relationships alongside their averages are shown below.
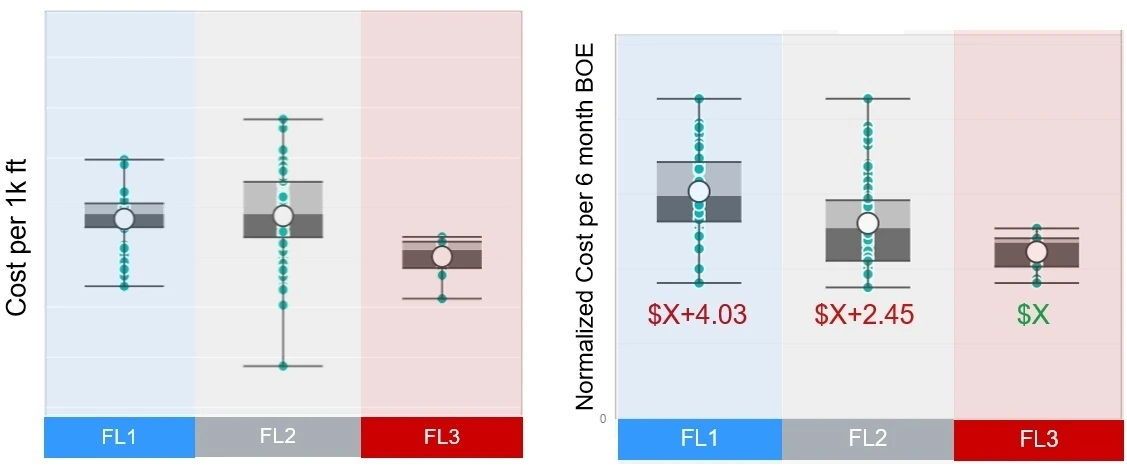
The chart to the left describes the average cost per completion fluid with F1 and F2 falling within a similar
range and nearly identical averages across the sampled set. FL3 on the other hand,
carries a meaningfully lower average completion cost in the range of $15k dollars cheaper
on average per 1000 completed horizontal feet. Economically this information suggests the cheapest route is
for an operator to go with FL3 for their completion fluid; however, this would only make
practical sense if it were to not sacrifice production attempting to use the cheapest completion fluid.
The chart to the right illustrates the average cost of completion as compared to the total 6 month oil
production normalized to 1000 horizontal completed feet. This chart represents
how much an operator spends on their completion to extract one barrel of oil from a well in the first 6
months of production. The optimal solution returns the most oil for the lowest cost.
The data presented suggests on average, the most economically practical completion fluid is FL3 which
produces a barrel of oil $4 dollars cheaper than FL1 and nearly $2 cheaper than FL2. We can
investigate further and represent the same depiction by specific operator subsets within particular
geographic locations.
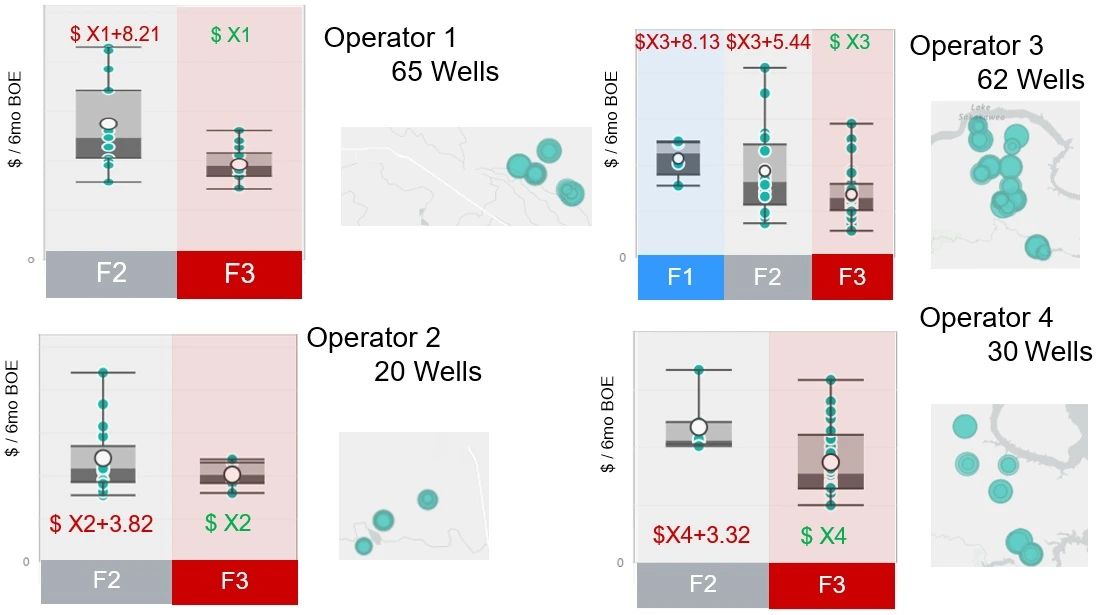
Evaluating $/BOE on an operator data subset further supports the previous findings. When the consumed volume
of the completion is >80% FL3 operators see a lower extraction cost. That is,
the cost to produce a single barrel of oil over the first 6 months of the well's production is the lowest
when FL3 is 80% of the completed volume. As operators continue to pursue
a greater profit return on their invested capital, they would be best suited to use FL3 as their dominate
completion fluid to have the greatest return on average across their wells.
The Oil and Gas industry has undergone broad volatility; however, objectives of
E&P companies has dominantly remained consistent. E&P companies
look to achieve the greatest cashflow per well while keeping costs minimal. This objective is achieved by
optimizing completions to lowest $ / BOE over a large quantity of completed wells
year over year. This study suggests FL3 is the optimal completion fluid across a wide area, and holds true
for a variety of operators across several basins and formations.
