Data Description
The original source data was accessed via the EIA API in JSON format. The EIA is the primary federal authority mandated to centralize, unify, and disseminate information related to U.S. energy. The EIA collects data through legislative reporting regulations, voluntary participation, and active surveys to provide accurate, independent, and impartial information.
The categories of data analyzed are presented below:
| Category | Unit of measurement |
|---|---|
| Reporting Date and Month | Year - Month |
| Crude Oil Exports Total | Thousand Barrels per Day (Mbpd) |
| Crude Oil Imports Total | Thousand Barrels per Day (Mbpd) |
| Crude Oil Production Total | Thousand Barrels per Day (Mbpd) |
| Natural Gas Imports | Billion Cubic Feet (bcf) |
| Total Natural Gas Exports | Billion Cubic Feet (bcf) |
| Natural Gas Marketed Production | Billion Cubic Feet (bcf) |
| Electricity Net Generation from Natural Gas All Sectors | Million Kilowatt-hours (MMkwh) |
| Electricity Net Generation from Petroleum All Sectors | Million Kilowatt-hours (MMkwh) |
| Electricity Net Generation Total | Million Kilowatt-hours (MMkwh) |
The dataset spans from 1995 to 2025 and consists of 5,000 rows of data aggregated monthly. Due to the official nature of the information provided by the EIA, little data cleaning was necessary. All fields had appropriate values as confirmed in the exploration and data migration. The ‘period’ field was presented as a string which was required conversion into an appropriate python date format for subsequent analysis. Since each category was broken out into their own SQLite table, data needed to be aggregated into their own data frame prior to analysis.
Results and Discussion
Figure 1: Crude Oil Trade Flows and Production
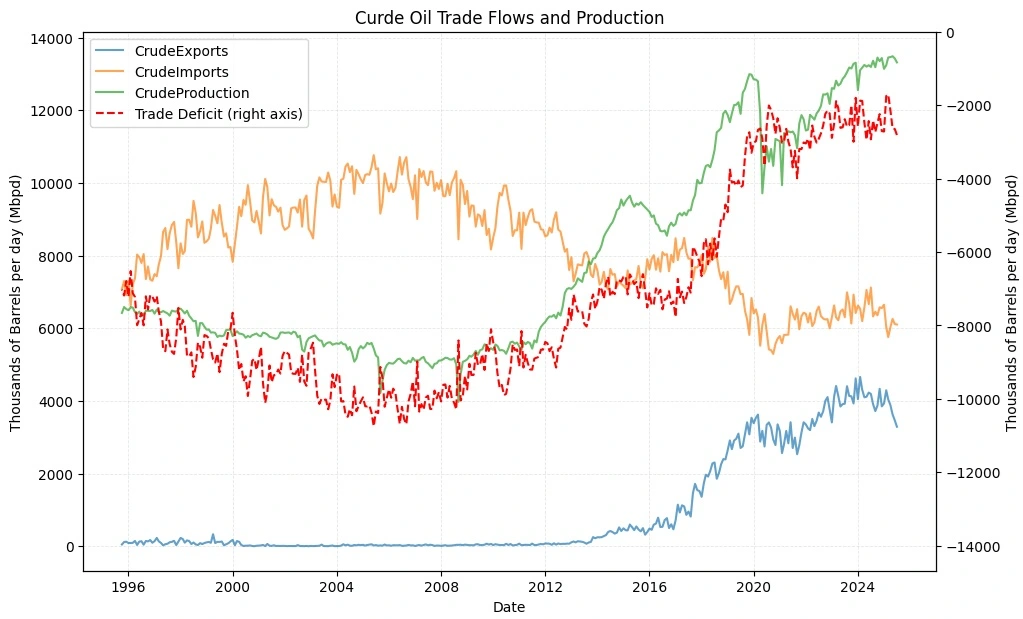
Figure 1 illustrates the overall trade flows and domestic production of crude oil in the U.S. from 1995. The crude oil trade deficit grew to its largest in the mid-2000's as crude oil imports peaked at nearly 10 million barrels per day where domestic oil production slumped supplying only 5 million barrels per day into the market.
Domestic oil production has surged since the September 2008 low of 4 million barrels per day to reaching nearly 14 million barrels per day in May of 2025. The massive expansion of domestic oil production has offset the trade deficit allowing the U.S. to become a crude oil exporter beginning around 2016. The U.S. continues to run a marginal crude oil trade deficit close to 2 million barrels of oil per day in 2025, despite the decade long growth of crude exports.
Figure 2: Natural Gas Trade Flows and Production

Figure 2 illustrates the overall flow of natural gas within the U.S from 1995 to present day. Like that of crude oil, the natural gas trade deficit reached its highest near 2008 with net imports reaching 400 bcf per day. U.S. domestic natural gas production has continuously increased over the course of the past 20 years with the lowest production seen in September 2009, growing to the U.S. highest production in May of 2025 – identical to the peak crude oil production.
The strength of the U.S. natural gas production and continuous growth has allowed the U.S. to become a net natural gas exporter since 2017. Based on current trends, natural gas production should continue to rise well into the future.
Electricity Generation Analysis
To understand why the U.S. has greatly increased the domestic production of fossil fuels over the past 20 years, it’s important to investigate the domestic energy demands that have taken place in the same period. Figure 3 shows the electricity generated in the U.S., and the percentage fossil fuels were used to create the total energy demand.
Between 1996 and 2024 U.S. energy production has increased by 1.7 trillion kilowatt-hours annually. Over the same period, petroleum electricity generation has contributed a negligible component of grid electricity and has phased out to nearly zero in the last decade. Natural gas has become increasingly important in domestic energy production accounting for 15% of all U.S. electricity production in 1996 to over 40% in 2024. This transition to natural gas electricity generation has become a suitable “green” substitute from crude products and mined materials.
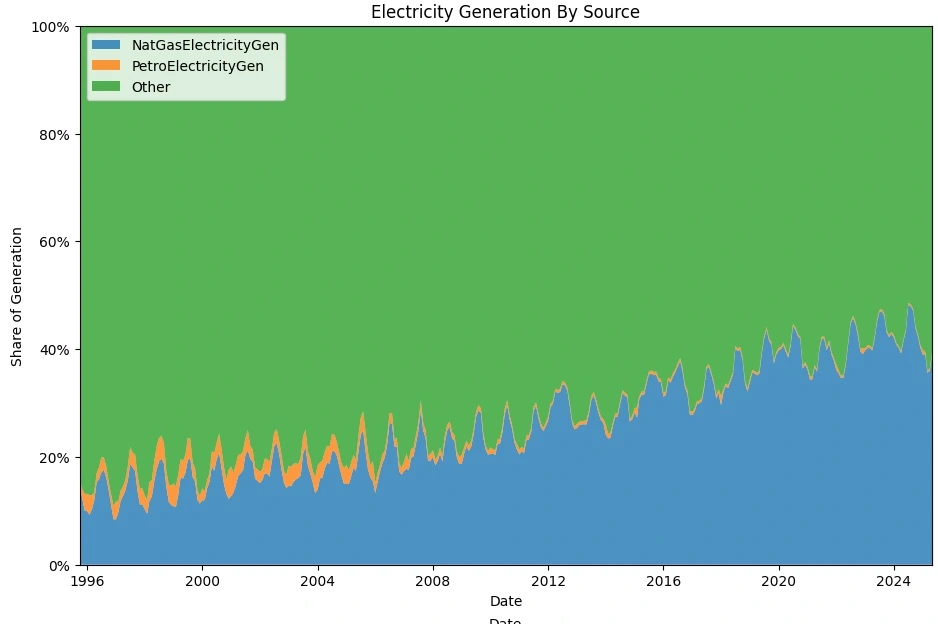
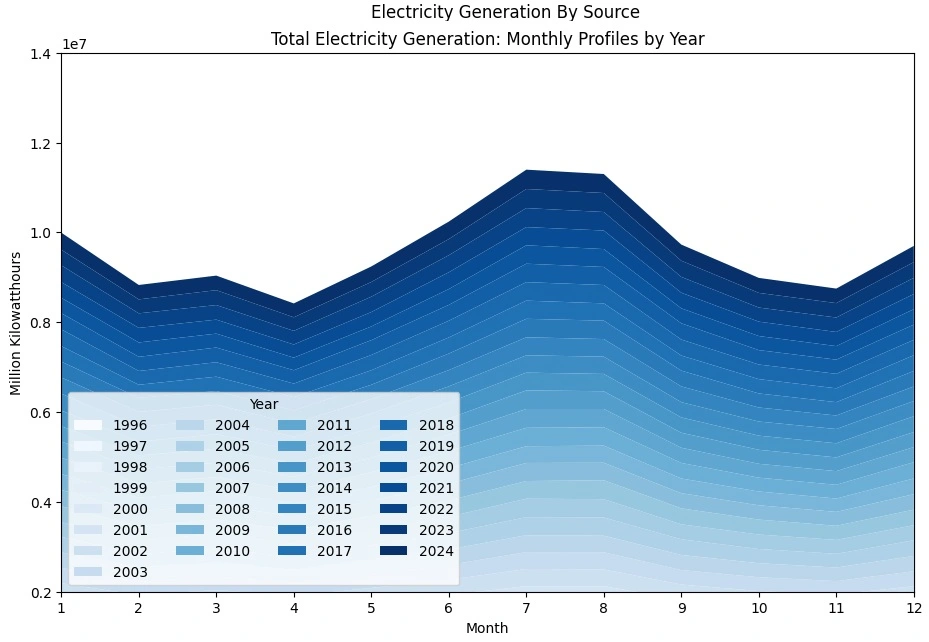
Figure 4 depicts the stacked energy production from 1996 to current date grouped by month to aid illustration of the sawtooth pattern seen during annual electricity production. An interesting wave fluctuation occurs at two points throughout the year: in the summer months when AC units are operating at full capacity, and in the colder winter months where additional heating is necessary. It’s important to note that although electricity can be used for winter heating, it can be consumed directly in furnaces to warm homes, and this utilization is not captured in the electricity production charts. We can anticipate additional natural gas utilization in the winter period greater than that of the summer months.
Conclusion and Recommendation
Modern, prosperous societies rely on the expectation that lights will remain on, gas stations will never run dry, and anything plugged into an outlet will function. U.S. energy security and independence are bedrock components of modern societies, and long-term availability and abundance is essential to sustain the quality-of-life U.S. citizens expect.
The analysis of U.S. energy resources, trade flows, and energy production over the past three decades outlines the changing U.S. energy landscape. Throughout the early 2000’s the U.S. was heavily reliant on both crude oil and natural gas imports where the trade balance was negative, and the country was reliant on fossil fuel imports from other countries to meet the growing energy demand. By the mid 2010’s, supported by the surging expansion of domestic extraction of crude oil and natural gas, the trade deficit on both resources began to balance and the U.S. has grown less reliant on external energy resources.
The U.S. still carries a modest trade deficit of crude oil and has expanded domestic production to become a net exporter of natural gas for the first time in U.S. history. During the transitional years of the past 3 decades U.S. electricity generation has shifted significantly toward natural gas to take advantage of the growing domestic production. Natural gas has expanded from supplying 15% of U.S. electricity generation in the 1990’s to now over 40% demonstrating a substantial structural change in energy infrastructure.
Natural gas faces large, seasonal demand fluctuations serving its dual role of heating our society in the cold winter months and supplying electricity to AC units in the warm summer months with slight demand reduction in between. These findings indicate the past 30 years has demonstrated substantial shifts in the U.S. energy independence, increasing volumes of domestic production, continuous reductions in energy resource trade balances, and greater reliance on natural gas to support the expanding energy demands within the U.S. These longitudinal trends have allowed the U.S. to become more resilient, less dependent on imports, and far more capable of suppling long-term energy security.
Recommendation: The U.S. must continue along this production growth trajectory to remain independent and exporter of energy resources.
Sources
- EIA website: www.eia.gov
- Data Source: EIA API V2 Total Energy Data